

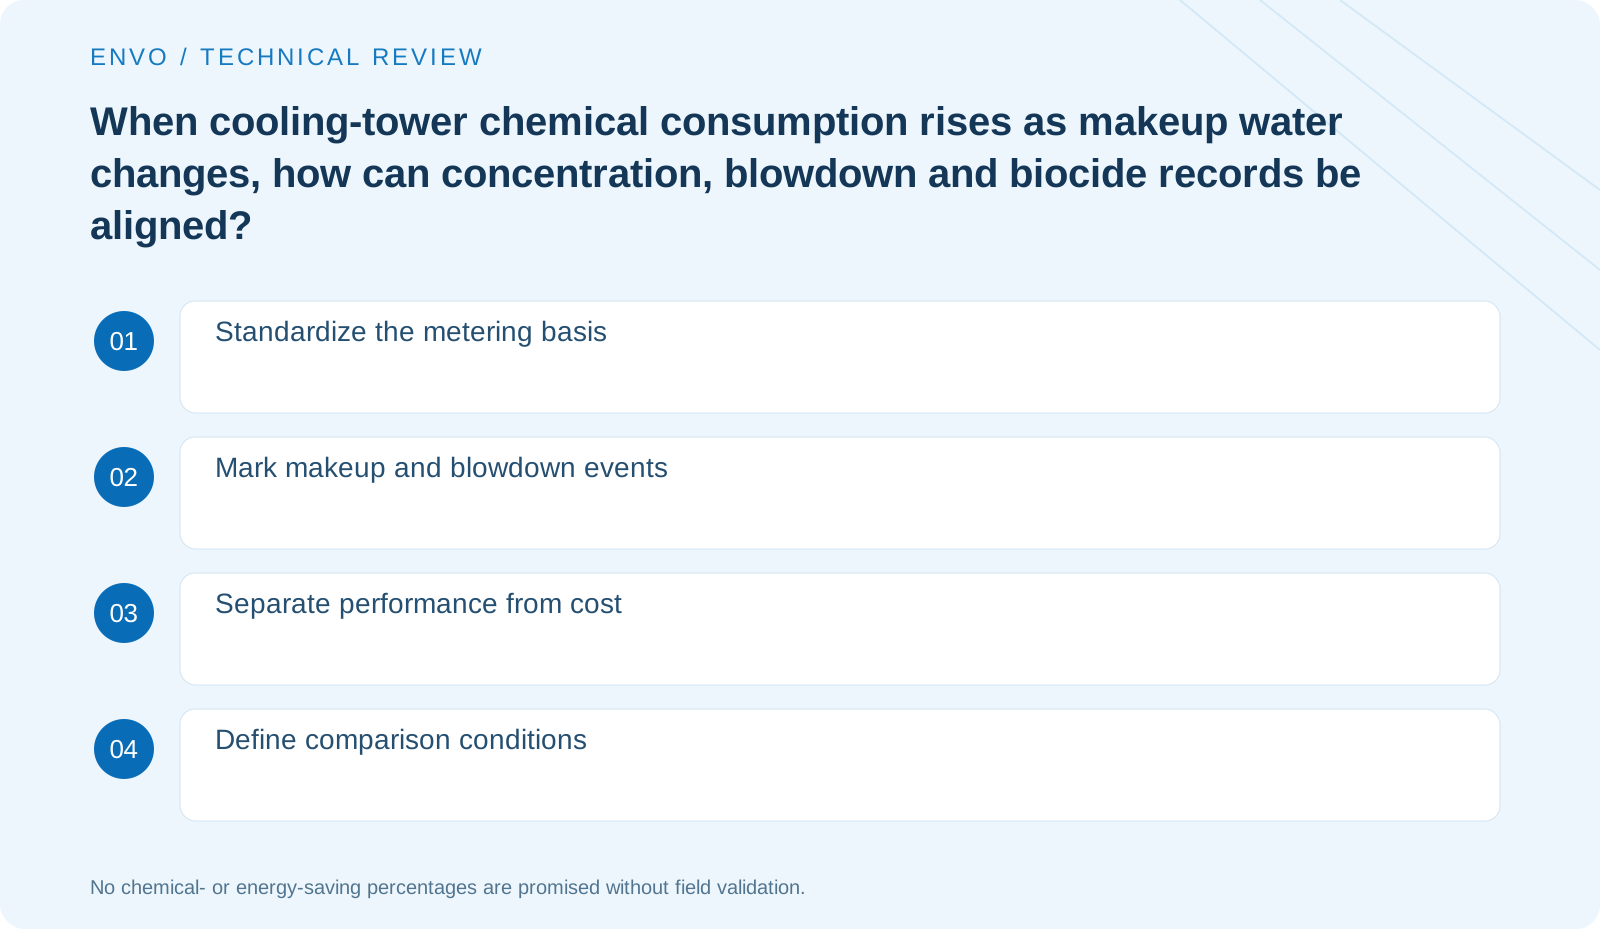
Align the statistical population and period
Specify whether chemical quantity means stock receipts, prepared solution or actual dosing, and whether water volume means makeup or total recirculation. Record units and start/end times rather than divide unlike quantities into an apparently precise consumption rate. For shared dosing equipment, first establish whether individual-tower attribution is possible. Preserve allocation uncertainty rather than manufacture definitive shares.
Record changes in hydraulic management
CDC includes blowdown, makeup water and automatic controls in cooling-tower operation and maintenance. Changes in blowdown settings, makeup source or load may invalidate period comparisons. Mark these events on trends before reviewing chemical-control records. If changes occur only on one shift, check recent filter maintenance, cleaning or equipment switching to avoid wrongly attributing them to the product batch.
Plot control performance and cost separately
Use one table for consumption and purchasing costs and another for established control objectives, tests and equipment conditions, linked by date. Low consumption with more anomalies is not necessarily a saving; higher consumption with substantially changed conditions is not automatically waste. Microbial status and equipment performance need their own appropriate indicators; one online signal cannot represent everything.
During analysis, assign an event number to each record and place increased makeup water, blowdown adjustments, fan switching and maintenance on the same timeline. If instruments record by the minute but manual testing occurs once per shift, preserve the different resolutions; do not treat a smooth interpolated curve as actual measurement. This makes the sequence of abnormalities meaningful for interpretation.
Formulate testable questions for anomalies
Ask, for example, whether control points remain representative after blowdown-mode changes rather than which biocide is best. Comparing similar loads under identical sampling conditions narrows variables requiring site review. Product-change trials should retain comparable conditions and define observation periods, permitted boundaries and stopping criteria instead of altering multiple settings together.
Turn the data package into an attachment to the technical inquiry
Provide a simple process diagram, product names and batches, metering basis, makeup/blowdown and control records, removing irrelevant personal information. Clarify whether the issue is consumption fluctuation, insufficient control or equipment support. Suppliers should explain their reasoning and missing information rather than substitute a chemical-savings chart for analysis. Public savings claims require comparable actual project data.
Explore further
Is lower chemical consumption always better?
Confirmed control and operating objectives must both be met; consumption alone cannot determine performance.
Can recirculation volume be used directly to calculate the volume of water treated?
First explain the calculation purpose and boundaries; circulating flow and makeup volume cannot share one undifferentiated basis.
References
This article draws on publicly available technical information. Third-party sources do not establish ENVO product approvals, field testing or project experience. Confirm each use against actual supply documents and site conditions.