

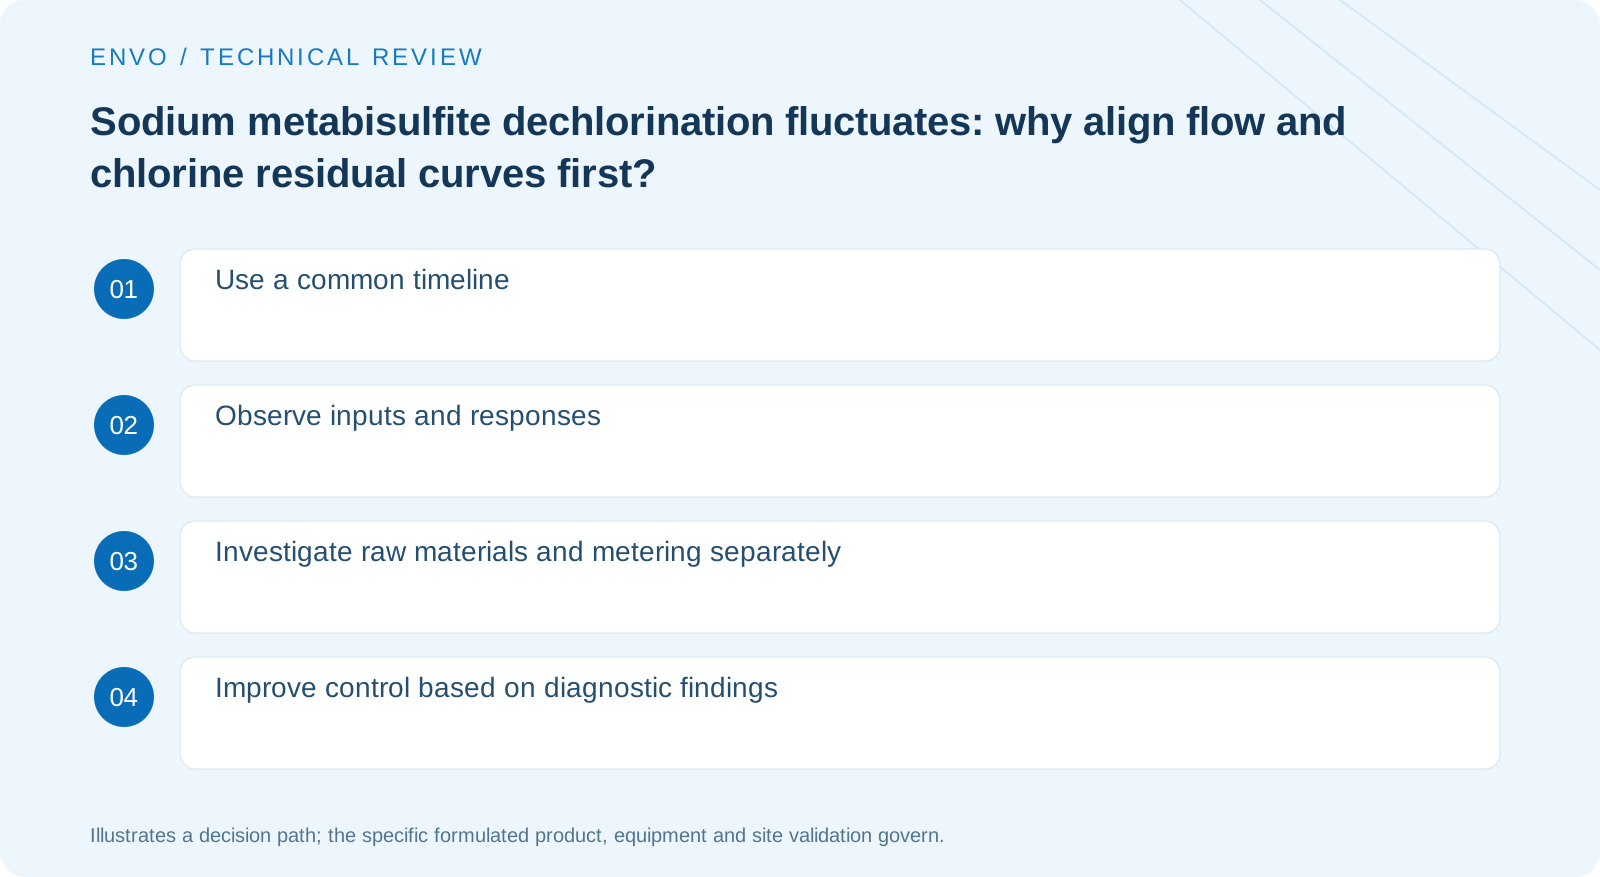
Establish a common time reference
Display feed flow, chlorine residual before and after dechlorination, and metering-equipment records on one time basis, checking that instrument clocks agree. Note delays before sample analysis. Misaligned times can make a normal response appear to fluctuate randomly.
Distinguish input changes from system response
Observe whether abnormal chlorine residual coincides with influent switching or flow changes, then check whether the response matches the existing design. EPA dechlorination materials identify control and monitoring as important stages. Choosing one reducing raw material alone cannot resolve every dynamic issue.
Check solid raw materials and actual metering conditions
Investigate raw-material quality, on-site formulated-product management and equipment metering separately. Compliance with ordered concentration does not establish proper metering operation; normal equipment signals do not replace verification of actual delivered quantity. Preparation and equipment operation should follow dedicated procedures. This page provides no site mixing ratios.
Let verification results guide improvements
If the main issue is the measuring point or response, address it first. If batch parameters deviate, follow the raw material quality process. Avoid raising settings after every fluctuation without keeping records. Final acceptance should consider both the dechlorination endpoint and downstream condition; lower readings are not invariably better.
Use synchronized records to distinguish load changes from response problems
Show influent flow, the chlorine species measured at the inlet, effluent tests and metering-equipment status over one time window, marking manual sampling. For clock offsets, preserve original records and explain corrections rather than moving curves to manufacture correlations. Site personnel should explain sampling-line and analysis delays so recording lag is not mistaken for chemical nonresponse.
If flow remains stable while the incoming oxidizing load changes, focus on load information. If feedwater conditions are similar but outlet results fluctuate, investigate mixing, metering and testing. If several factors change together, acknowledge that they may be difficult to separate at present. These branches organize verification; they are not rules for automatically adjusting sodium metabisulfite dosage.
Check whether acceptance data cover steady operation, transitions and identified fluctuations. One low-load record cannot establish full-range compliance. Add missing conditions to subsequent validation and assign responsibility for equipment curves and water analysis. Procurement then includes clear raw-material specifications and actionable system checks.
Explore further
Should fluctuations first be addressed by switching to higher-purity raw materials?
Determine the cause first; purity does not explain every fluctuation.
Can manual testing once daily explain brief fluctuations?
Not necessarily. Record data at intervals appropriate to the actual fluctuations.
References
This article draws on publicly available technical information. Third-party sources do not establish ENVO product approvals, field testing or project experience. Confirm each use against actual supply documents and site conditions.